Latest half-hour
Wind is supplying most of Britain’s electricity at 16.1 GW (50%).
Generation 32.2 GW, plus Imports 7.7 GW, minus Exports 1.2 GW, equals Demand 38.7 GW.
Share of generation · of 32.2 GW generation
Carbon intensity 84 gCO₂/kWh
- Gas4.7 GW · 15%
- Biomass3.2 GW · 10%
- Other1.5 GW · 5%
- Pumped storage1.0 GW · 3%
- Hydro0.6 GW · 2%
Fossil fuels
4.7 GW
15%
Gas
4.7 GW
15%
Coal
0.0 GW
0%
Oil
0.0 GW
0%
Wind, solar and hydro
16.8 GW
52%
Solar
0.0 GW
0%
Wind
16.1 GW
50%
Hydro
0.6 GW
2%
Other sources
9.7 GW
30%
Nuclear
5.0 GW
15%
Biomass
3.2 GW
10%
Other
1.5 GW
5%
Interconnectors
6.5 GW
net import
France
3.0 GW
net import
Denmark
1.4 GW
net import
Norway
1.4 GW
net import
Ireland
1.0 GW
net export
Belgium
1.0 GW
net import
Netherlands
1.0 GW
net import
Northern Ireland
0.3 GW
net export
Storage
1.0 GW
3%
Pumped storage
1.0 GW
3%
Battery
Not reported separately by the source.
Demand and generation, including embedded
- Exports (generation above demand)
- Imports (demand above generation)
- Demand
- Generation
Contains BMRS data © Elexon Limited copyright and database right 2026. Supported by National Energy SO Open Data. GB solar estimates from Sheffield Solar PV_Live, University of Sheffield, developed with NESO.
Look-ahead
Cleanest time to use power in the next 48 hours: 25 Oct 2026, 10:30–12:30 GMT (≈29 g).
Wind is forecast to rise to 19.6 GW by tomorrow evening.
Grid fetched 20:00 BST · Elexon WINDFOR · Contains BMRS data © Elexon Limited copyright and database right 2026. · National carbon intensity from the NESO Carbon Intensity API (CC BY 4.0). Developed by NESO with the University of Oxford, Environmental Defense Fund Europe and WWF.
Price
170.6 £/MWh
Carbon
88 g
Demand
30.1 GW
Generation
25.2 GW
Transfers
5.4 GW
Power infrastructure in GB
What is built and what is in the pipeline, from the public registers.
England, Scotland and Wales.
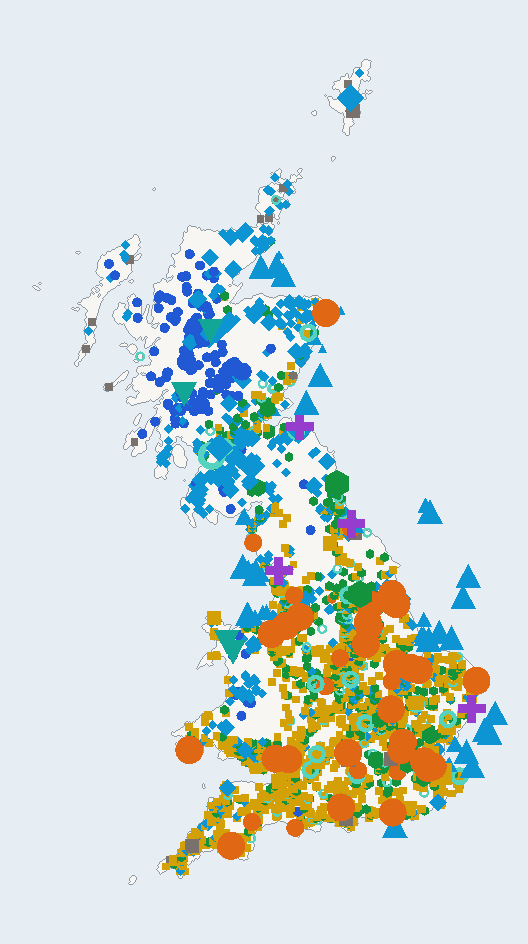
- Under 50 MW
- 50–299 MW
- 300 MW and over
Operating
99.8 GW
3,366 sites
Rated capacity is not published for 49 sites. The gigawatts are the published total.
- Gas31.9 GW 48
- Offshore wind16.9 GW 51
- Onshore wind15.2 GW 750
- Solar12.4 GW 1,538
- Bioenergy and waste7.1 GW 586
- Nuclear5.9 GW 5
- Battery storage4.9 GW 177
- Pumped storage2.9 GW 4
- Hydro1.7 GW 180
- Oil and other0.9 GW 27
- England68.0 GW
- Scotland21.5 GW
- Wales10.3 GW
Pipeline
267.4 GW
7,668 projects
Rated capacity is not published for 991 projects. The gigawatts are the published total.
- Under construction27.9 GW 452
- Consented145.3 GW 5,779
- In planning94.2 GW 1,437
Consent does not mean a project will be built.
Contains public sector information licensed under the Open Government Licence v3.0.
REPD Q2 2026 · DUKES May 2026
What does electricity cost?
Where is power flowing?
Latest flows
2.00 GWin
1.43 GWin
1.40 GWin
1.00 GWin
0.99 GWin
0.96 GWin
0.53 GWout
0.51 GWout
0.25 GWout
Flows over time
Flows to and from Northern Ireland. NI figures are on a separate page.
How has the mix changed?
Gas and oil prices
Records and the energy transition
Highest wind since Grid's records began
23.9GW
Wed 25 Mar 2026, 13:30 GMT
Lowest carbon since Grid's records began
19g
Mon 15 Apr 2024, 14:30 BST
Days since coal power ended
753
30 Sep 2024
All records and wind milestones · Supported by National Energy SO Open Data
Coal gives way to wind
- Coal, share of generation
- Wind, share of generation
In 2009, coal supplied 28% of the mix and carbon intensity averaged 444 gCO₂/kWh.
By 2026, coal’s share is 0% and carbon intensity has fallen to 142 g.
Wind has moved from 1% to 31% of generation over the same years.
Supported by National Energy SO Open Data.
How clean is it?
Cleanest time to use power in the next 48 hours: 25 Oct 2026, 10:30–12:30 GMT (≈29 g).
Grid fetched 20:00 BST · NESO Carbon Intensity API